How to Access the Analytics Report
To open your analytics report:
Open your form.
Click Results.
Select the Analytics tab.
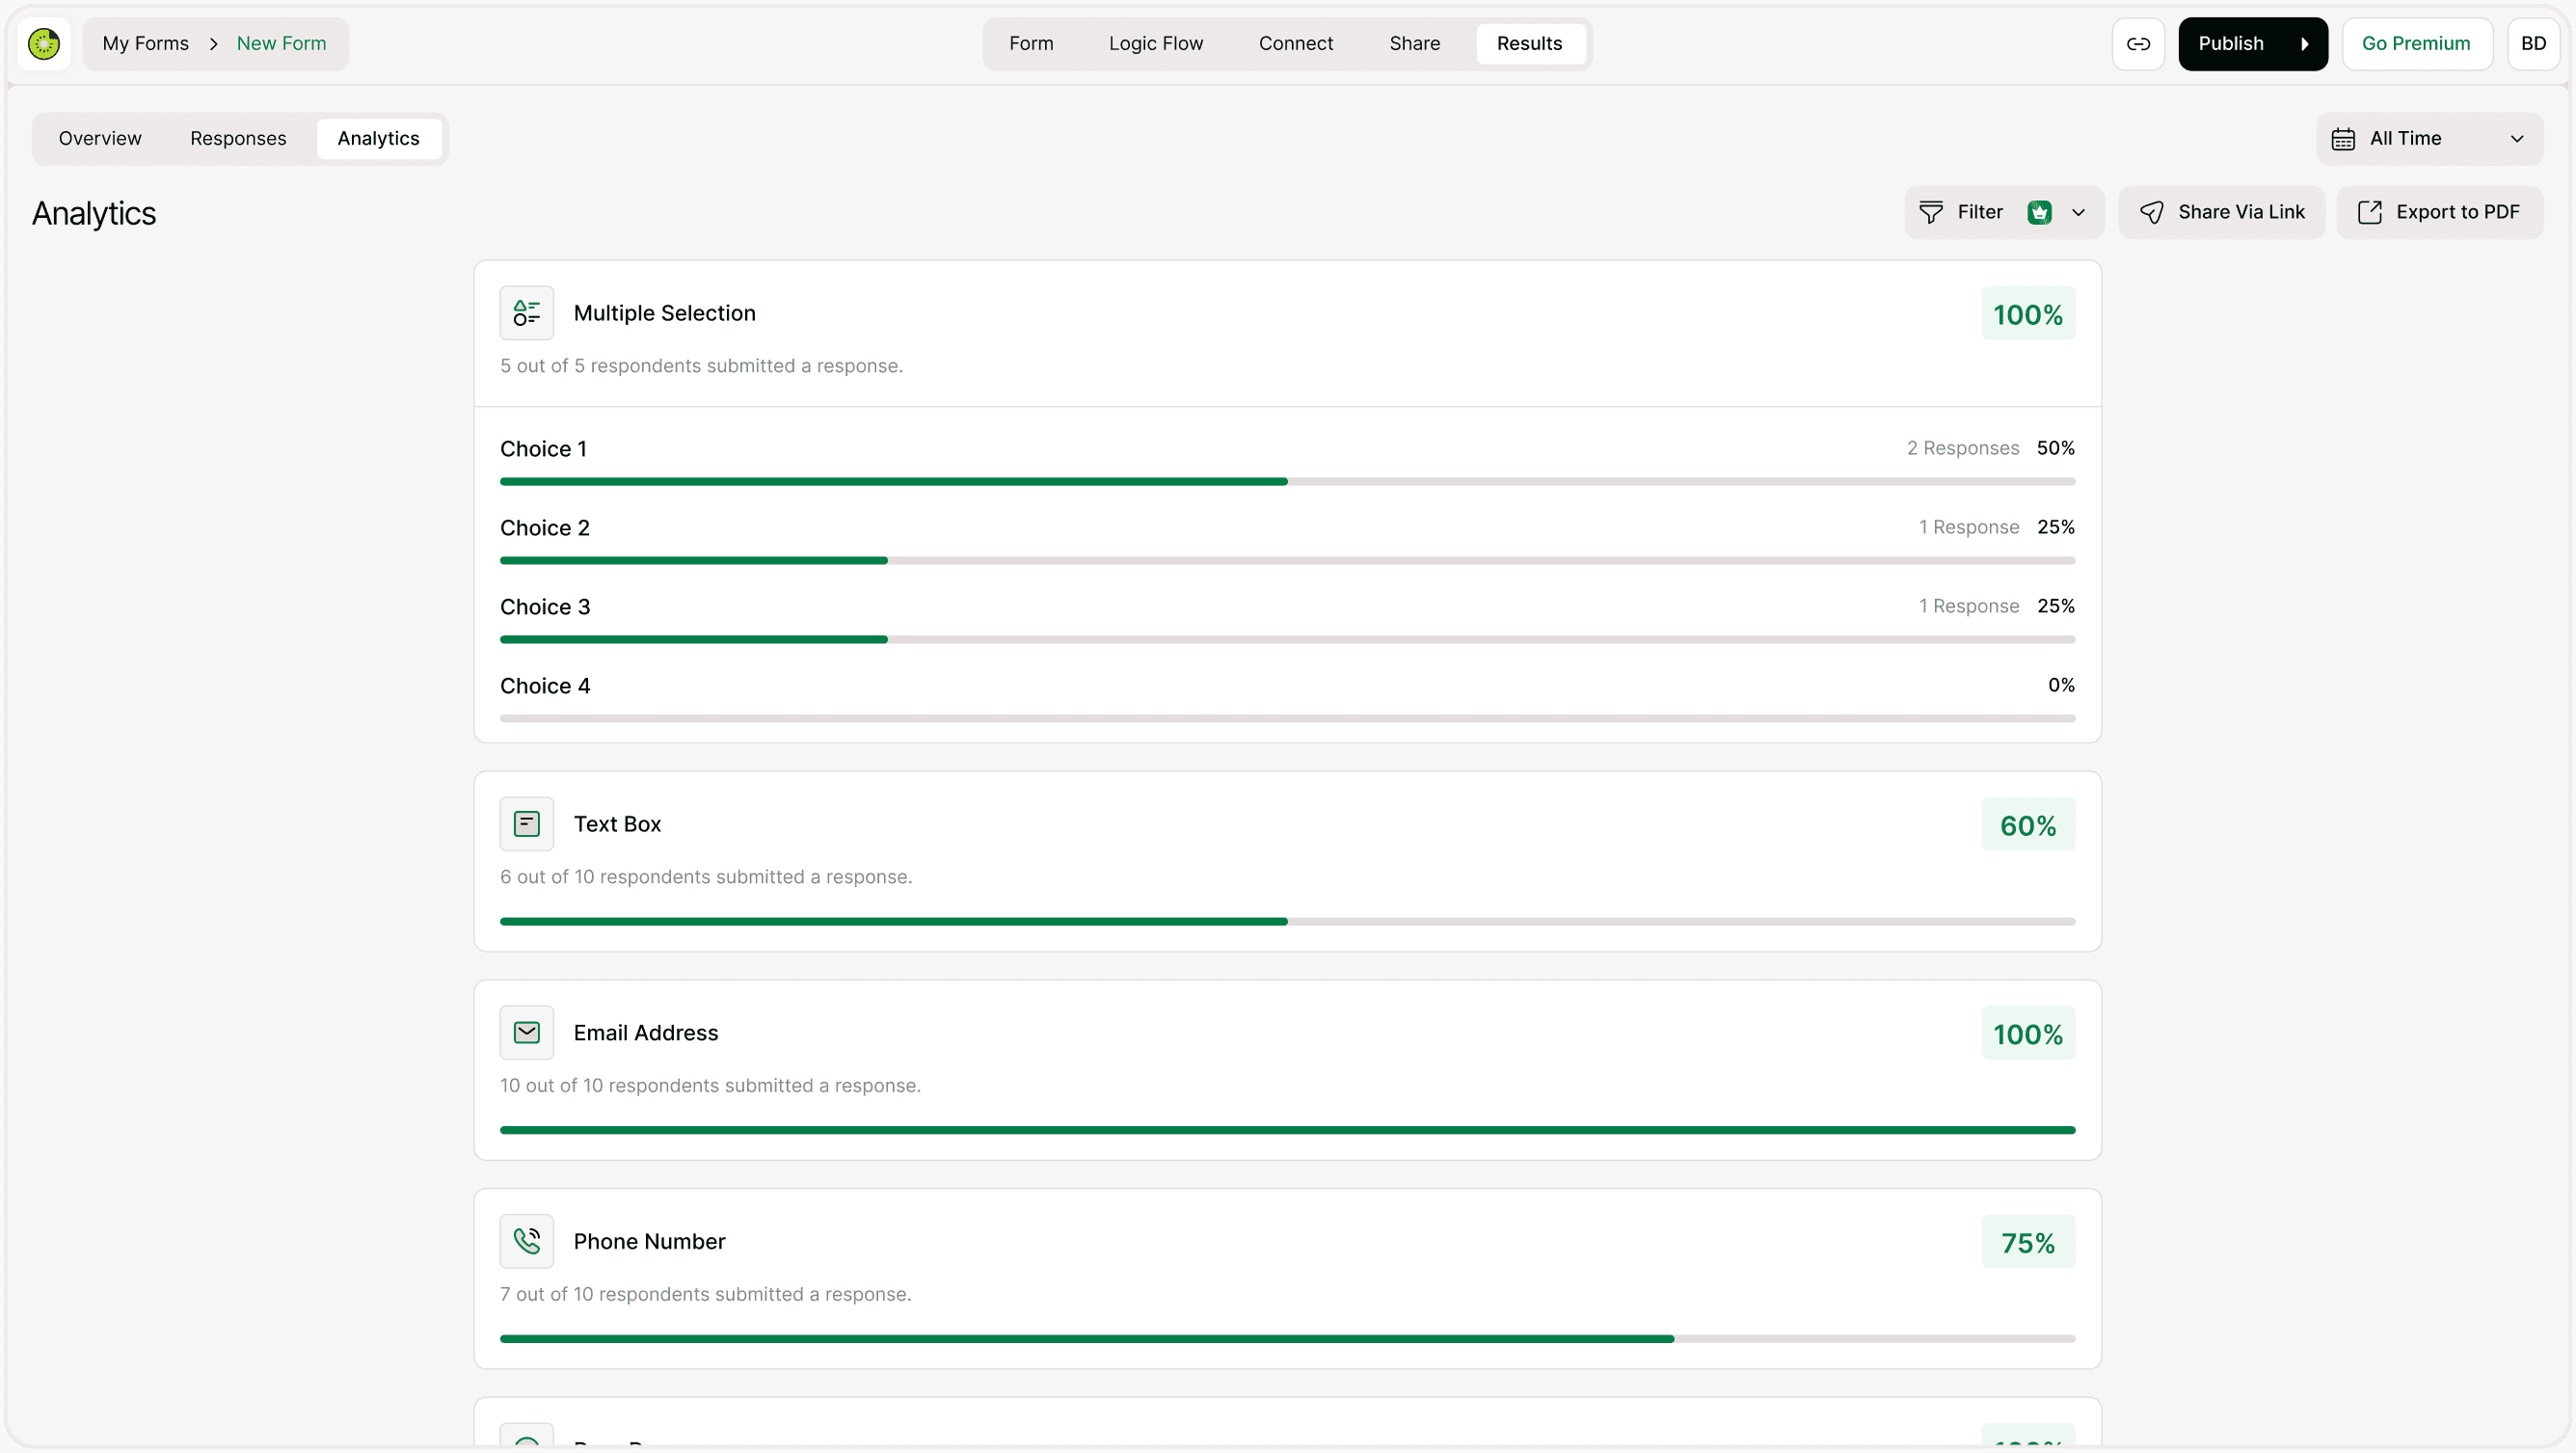
You’ll see a clean dashboard showing performance metrics for every question in your form.
What the Analytics Report Shows
Each question in your form displays:
Total responses received
Percentage completion
Distribution of answer choices
Visual progress bars
Response count per option
This allows you to quickly compare answer trends and understand respondent behavior.
Question by Question Breakdown
For multiple choice or dropdown questions, you’ll see:
Each option listed separately
Number of responses per option
Percentage of total responses
Visual progress bar for easy comparison
For text-based questions, you’ll see:
Submission rate percentage
How many respondents answered the question
This structure makes it easy to identify popular answers or skipped questions.
Understanding Response Rates
Each question includes a percentage indicator such as:
100% → All respondents answered
60% → Some respondents skipped the question
75% → Partial engagement
Lower percentages may indicate:
Question confusion
Poor placement in form flow
Optional question being ignored
Improving response rates improves data quality.
Filtering Analytics by Time
You can filter analytics by:
All Time
Custom time ranges
This is helpful for:
Campaign analysis
Comparing performance across periods
Tracking improvements over time
Time-based filtering allows better trend tracking.
Sharing the Analytics Report
Kiwiform allows you to share analytics via:
Public Share Link
No login required
Real-time updates
Share with clients or team members
You can generate a public link and copy it instantly.
Exporting Analytics to PDF
You can export the analytics report as a PDF file.
Best for:
Presentations
Stakeholder reporting
Monthly performance summaries
Client reporting
The exported PDF maintains visual formatting for professional sharing.
When Should You Use Analytics Reports?
Analytics reports are useful for:
Survey performance tracking
Customer feedback analysis
Event registration trends
Product research
Marketing campaign evaluation
Instead of reviewing raw data, you get immediate visual clarity.
Best Practices for Using Analytics
Review analytics regularly.
Monitor low-response questions.
Compare performance before and after changes.
Use filtered time periods for campaign analysis.
Export reports for stakeholder discussions.
Consistent monitoring improves form effectiveness.
Summary
The Analytics Report provides a visual breakdown of each question’s performance, including response percentages and answer distribution. With sharing and export options, you can easily present insights and track trends over time.