What Is the Insights Page?
The Insights page provides visual summaries and analytical breakdowns of your form responses. It focuses on patterns and trends rather than individual submissions.
You can use Insights to:
Analyze question-level performance
Identify popular or common responses
Track trends over time
Detect drop-offs
Compare response distributions
This helps you move from collecting data to understanding it.
How to Access Insights
To view form insights:
Open your form from the dashboard.
Click Results.
Navigate to the Insights tab.
The page will automatically display visual summaries of collected responses.
Question-Level Analysis
Insights allow you to analyze each question individually.
For example:
Multiple-choice questions show distribution charts.
Rating questions show average scores.
Text responses can be reviewed for recurring themes.
Dropdown questions show selection frequency.
This helps you quickly identify:
Most selected options
Underperforming areas
Customer preferences
Satisfaction trends
Instead of reviewing every response manually, you can interpret patterns instantly.
Understanding Response Trends
If your form collects responses over time, Insights can help you detect changes such as:
Improvement in satisfaction scores
Increased demand for a service
Popular product features
Seasonal changes in behavior
This is especially useful for:
Ongoing feedback forms
Monthly surveys
Product research
Customer experience tracking
Monitoring trends helps you make data-backed decisions.
Identifying Drop-Off Patterns
Insights may highlight where users abandon your form.
If a particular question causes a drop-off:
Simplify the question
Make it optional
Reduce required fields
Improve clarity
Improving weak points increases overall completion rates.
Visual Data Representation
Insights use charts and summaries to simplify complex data.
Instead of spreadsheets, you see:
Bar charts
Percentage breakdowns
Average values
Comparative distributions
Visual analytics make it easier to present findings to your team or stakeholders.
How to Use Insights for Optimization
Data is only valuable when applied.
Improve Form Design
Remove confusing questions and simplify structure.
Increase Conversion Rates
Optimize based on completion trends.
Refine Messaging
Adjust wording based on response patterns.
Improve Products or Services
Use feedback trends to guide improvements.
Continuous iteration improves results over time.
Best Practices for Reviewing Insights
Check insights regularly for active forms.
Compare performance before and after edits.
Monitor satisfaction trends.
Identify frequently chosen answers.
Use data to guide changes, not assumptions.
Small, data-driven adjustments can significantly improve outcomes.
Insights vs Responses vs Overview
To understand the difference:
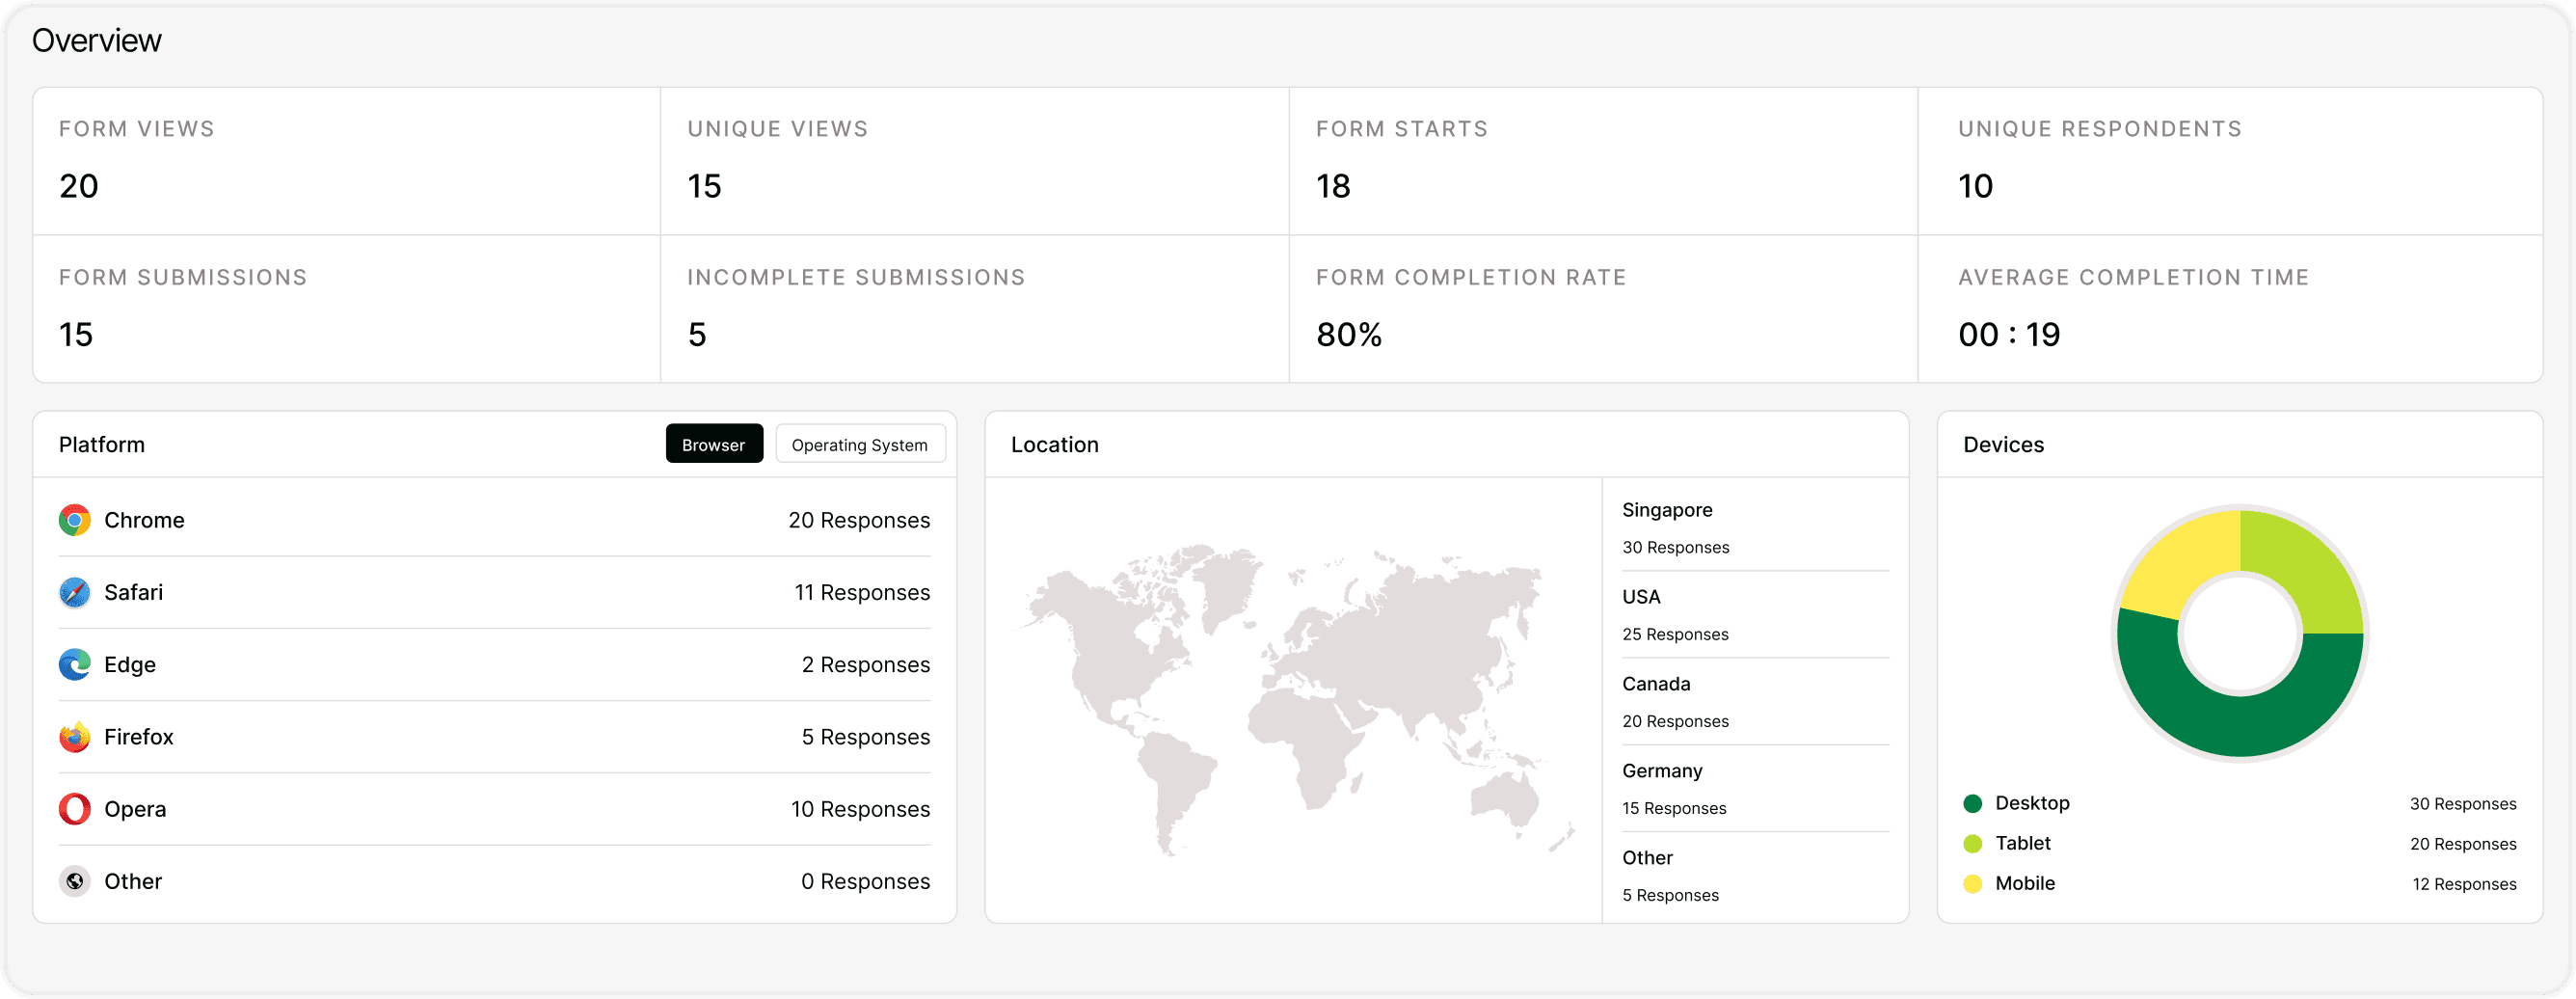
Overview → High-level performance metrics
Responses → Individual submission details
Insights → Aggregated patterns and trends
Together, they provide a complete analytics experience.
Summary
The Insights page transforms raw responses into visual, actionable analytics. By analyzing trends, distributions, and question-level performance, you can optimize your forms, improve engagement, and make smarter decisions.