How to Access Results Overview
To view your form analytics:
Open your form from the dashboard.
Click on Results in the top navigation.
Select the Overview tab.
You will see performance metrics and visual breakdowns immediately.
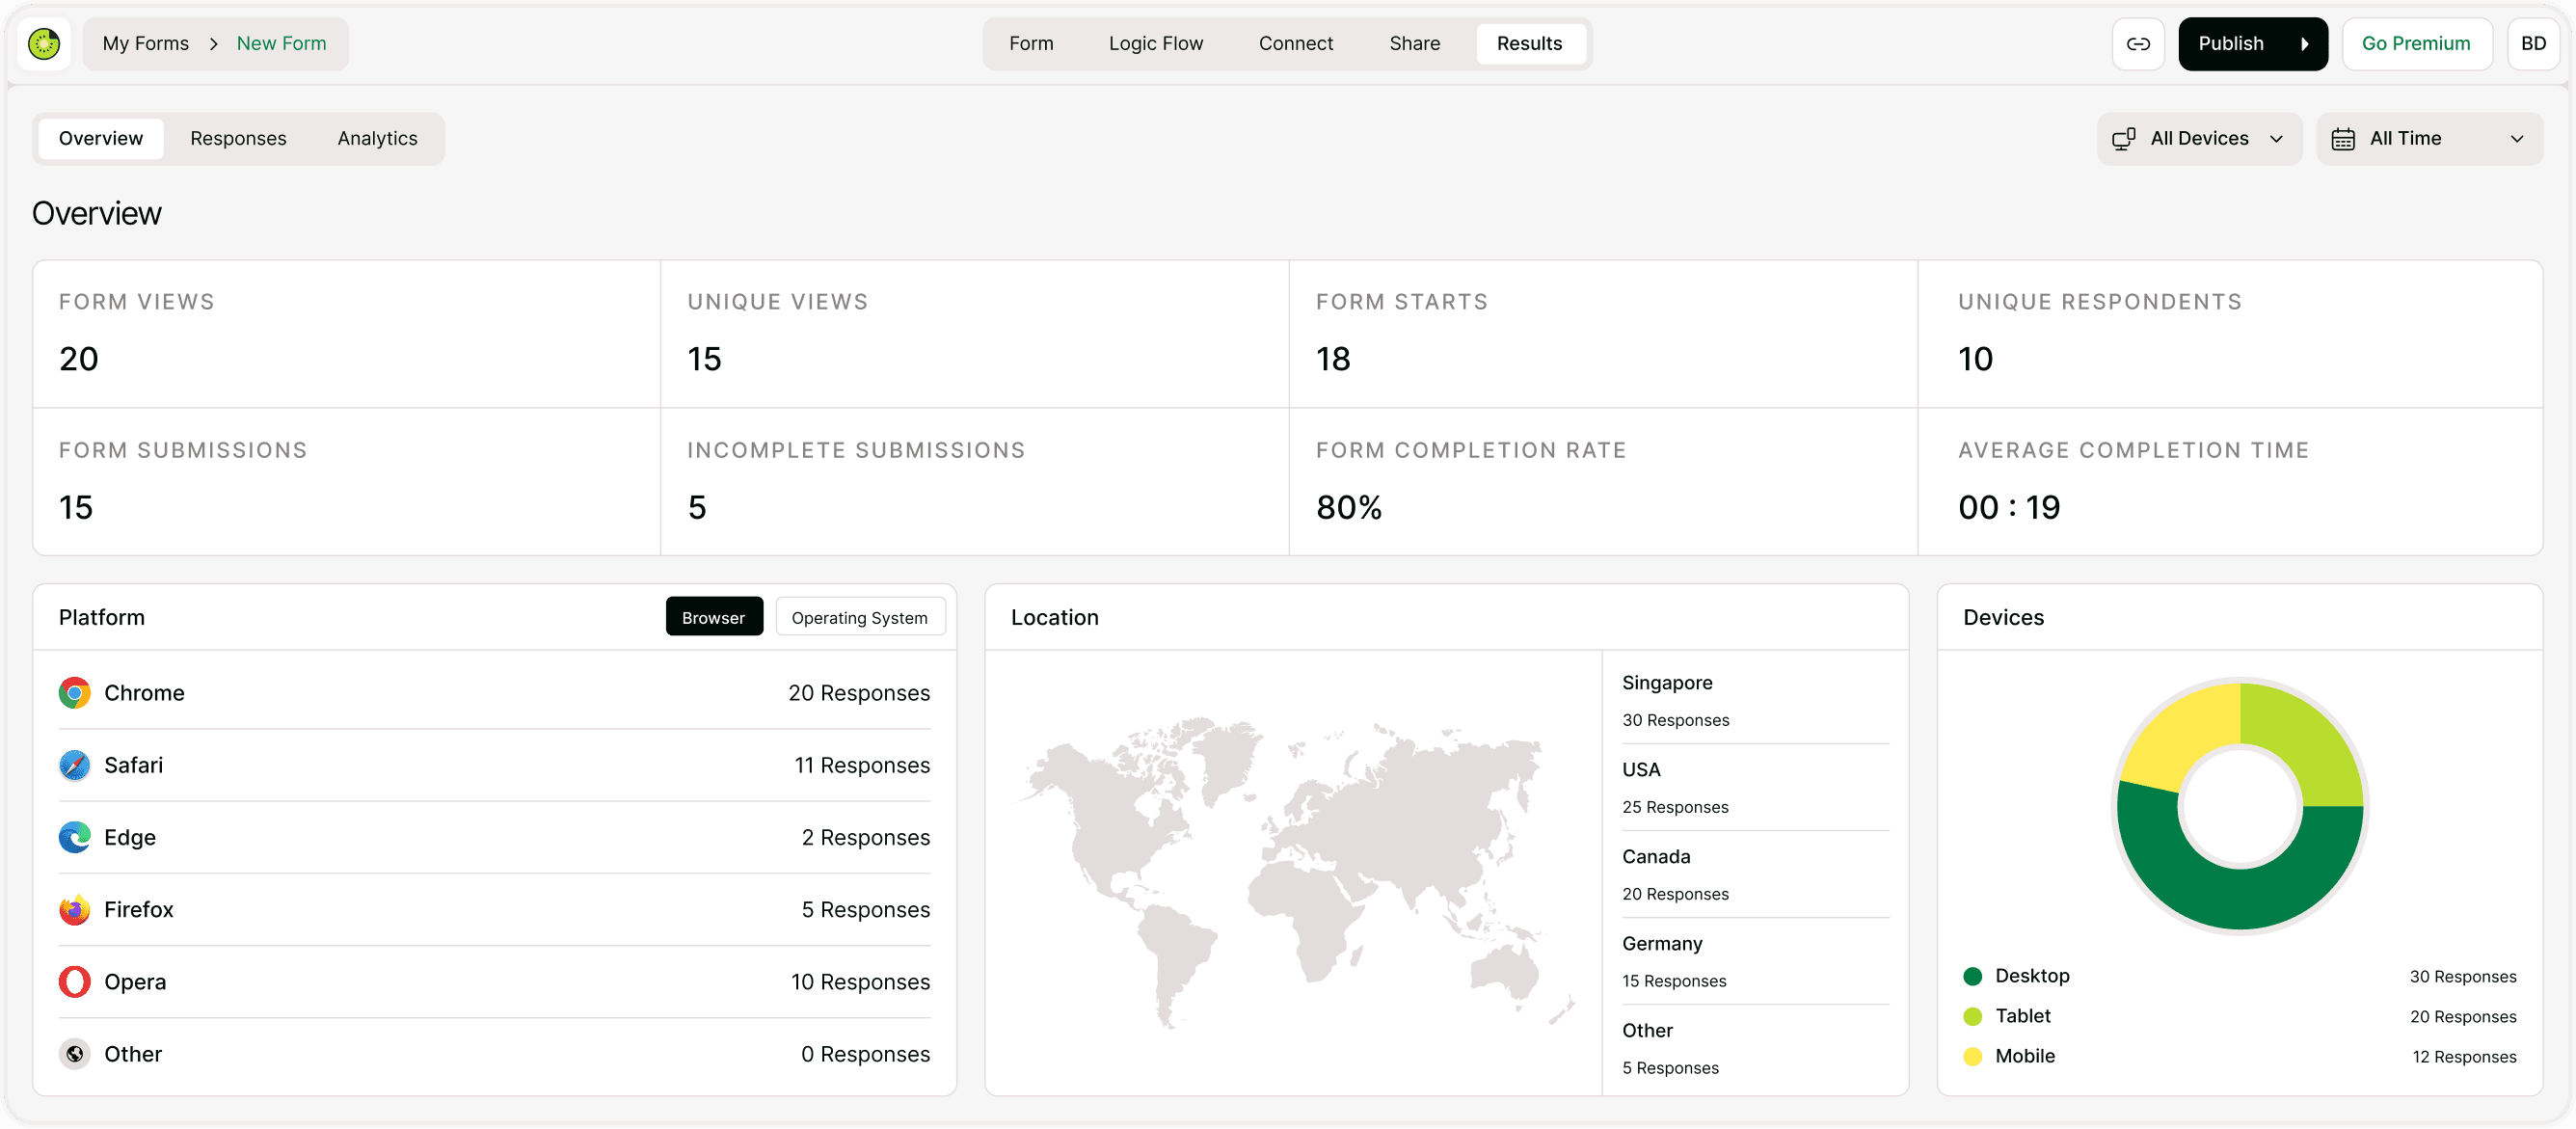
Key Performance Metrics Explained
At the top of the page, you’ll see summary cards. Each one provides insight into your form’s performance.
Form Views
The total number of times your form was opened.
This includes repeat visits from the same user.
Use this to measure overall traffic to your form.
Unique Views
The number of individual users who viewed your form.
Unlike total views, this removes duplicate visits from the same user.
This helps you measure real reach.
Form Starts
The number of users who began filling out your form.
If views are high but starts are low, your introduction may need improvement.
Unique Respondents
The number of distinct users who submitted your form.
This helps prevent counting duplicate submissions from the same user.
Form Submissions
The total number of completed form submissions.
This is your primary conversion metric.
Incomplete Submissions
The number of users who started but did not complete the form.
If this number is high, you may want to:
Shorten the form
Improve question clarity
Simplify required fields
Average Completion Time
The average time users take to complete your form.
If this is very high:
Your form may be too long
Questions may be unclear
Users may be confused
Optimizing this improves engagement.
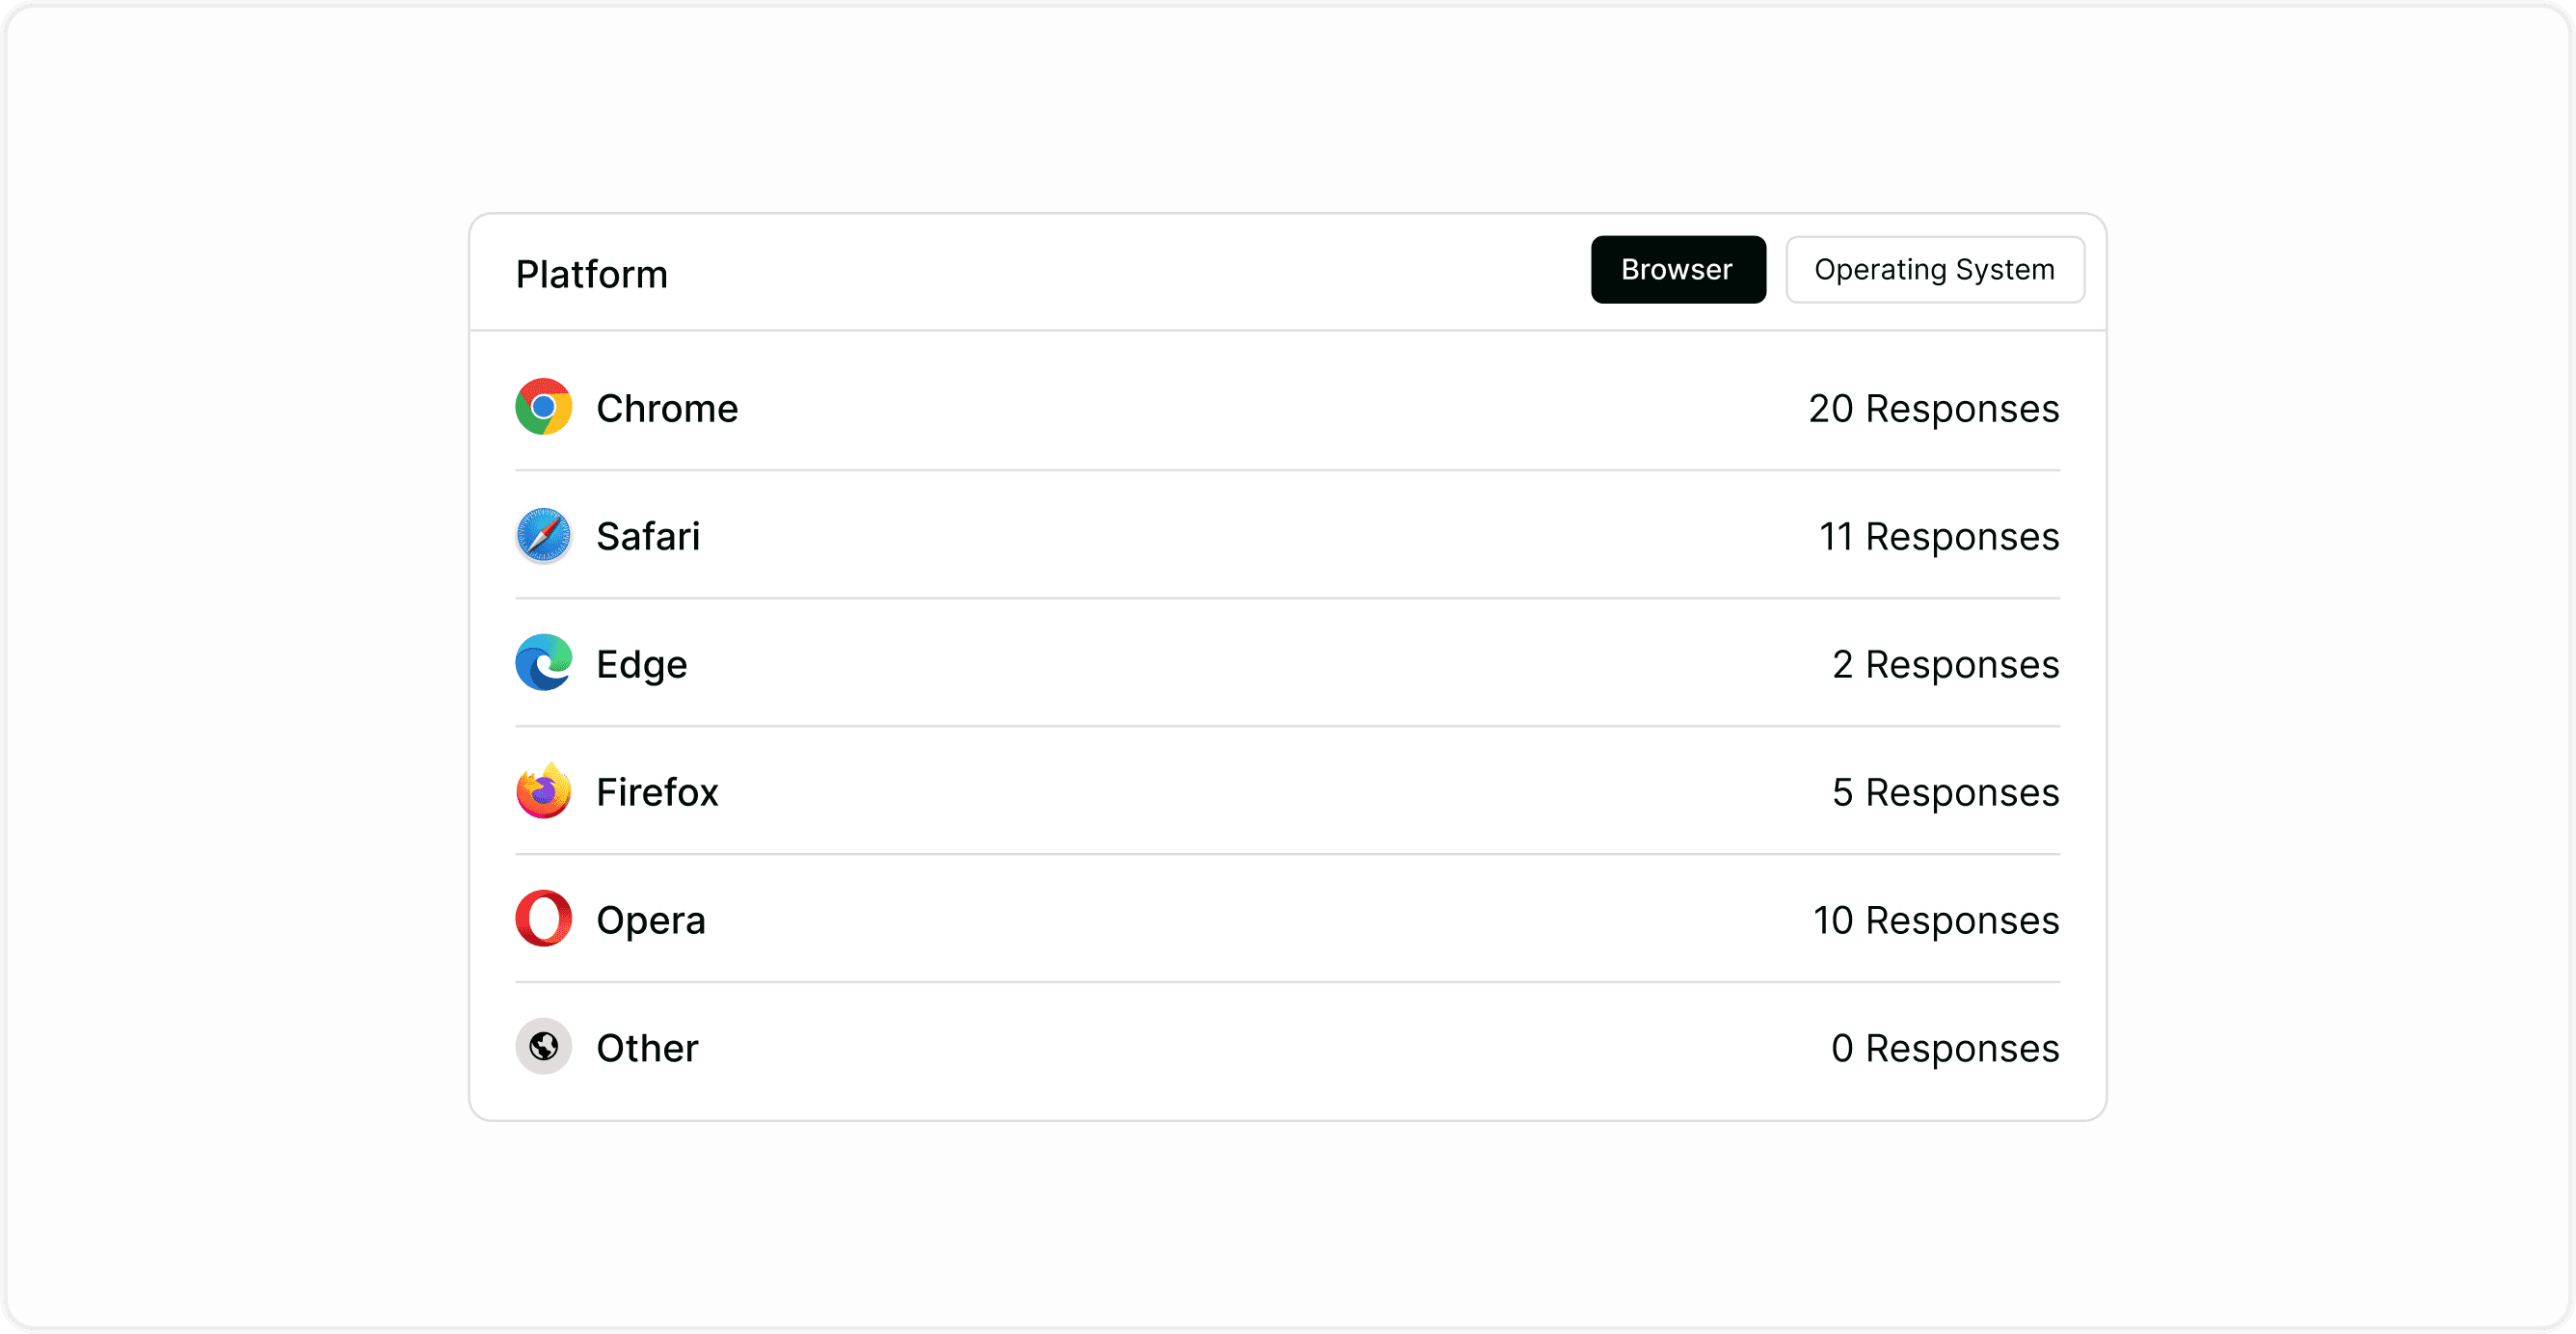
Platform Breakdown (Browser & Operating System)
Under the performance metrics, you’ll see the Platform section.
You can toggle between:
Browser
Operating System
This shows where responses are coming from (e.g., Chrome, Safari, Edge, Firefox).
Why this matters:
Helps identify compatibility issues
Ensures proper browser testing
Detects technical problems
Location Insights
The Location map displays where responses are coming from globally.
This helps you:
Understand audience geography
Identify growth markets
Analyze campaign reach
If you're running targeted campaigns, this data helps validate results.
Device Analytics
The Devices section shows whether users completed your form on:
Desktop
Tablet
Mobile
If mobile usage is high:
Ensure your form is optimized for mobile
Keep text short
Avoid large image backgrounds
Mobile optimization directly impacts completion rates.
Filters: All Devices & All Time
In the top-right corner, you can filter results by:
Device type
Time range
This helps you analyze:
Campaign performance over time
Device-specific trends
Short-term vs long-term growth
Use time filters when reviewing recent marketing efforts.
How to Use Results Data to Improve Your Form
Analytics are only useful if you act on them.
Low Starts?
Improve your welcome screen and CTA.
High Incomplete Submissions?
Reduce required fields and simplify questions.
Low Completion Rate?
Shorten your form and add logic to remove unnecessary steps.
High Mobile Usage?
Optimize layout for small screens.
Continuous optimization improves performance over time.
Why Results Overview Matters
Understanding your data helps you:
Increase conversion rates
Improve user experience
Identify drop-off points
Make smarter design decisions
Optimize marketing campaigns
Kiwiform makes this process simple and accessible, especially for teams looking for a free Typeform alternative that combines flexibility with built-in analytics.
Best Practices for Reviewing Results
Check analytics weekly for active campaigns.
Compare time periods to track growth.
Test form changes and measure improvements.
Monitor completion rate after edits.
Use device insights to guide design decisions.
Small improvements can lead to significant performance gains.
Summary
The Results Overview dashboard gives you a complete snapshot of your form’s performance. By tracking views, submissions, completion rates, device usage, and geographic data, you can make informed decisions and continuously improve your forms.